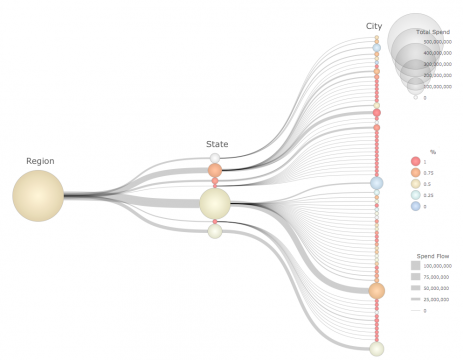
Hierarchical view of spending by city, state and region.
IBM just posted a quick blog post of mine on their Business Analytics blog site. The post addresses the general theme of visual navigation, comparing old school approached with external controls vs. integrated approaches that combine the visual views and navigational controls within a single metaphor. To illustrate these concepts I compare the use of traditional dashboard tabbed hierarchies with a single hierarchical visualization that shows multiple levels of detail simultaneously. Read the short article for more details.